 Is the triphasic chart of the basal body temperature in the course of the cycle a sign of pregnancy? All about triphasic temperature curves can be found in this article!
What is a Triphasic Temperature Chart?
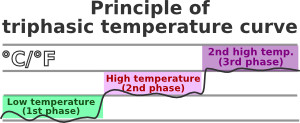
A triphasic temperature chart means that the basal temperature rises slightly about a week after the rise in temperature triggered by ovulation. The expression comes from the fact that in a normal cycle curve with ovulation, a biphasic course of temperature can always be observed. This means that the curve can in principle be divided into two parts – the low-level temperature and high-level temperature position. In some cycles, however, three phases can be detected and this is called the triphasic temperature curve or triphasic chart.
Does the triphasic chart indicate implantation?
Whether such a triphasic chart can indicate implantation has not yet been clearly clarified. So far, there are only empirical values. In a survey by the App Fertility Friend, it emerged that around 12.8% of the pregnancy curves had a triphasic temperature curve. However, this phenomenon has also been observed in 4.4% of non-pregnancy curves. Implantation only happens with an existing pregnancy. Interestingly enough, the third phase almost always begins, approximately when implantation begins. This is probably the reason why the fallacy has spread that a triphasic chart can indicate implantation. In my experience, this is not true and is more of a biological coincidence. Unfortunately, there are no clinical studies for triphasic temperature curves yet, so unfortunately it is no longer possible to say more on this.
Evaluate Basal Body Temperature (BBT)
Evaluating the basal body temperature is highly recommended in any case if you want to get pregnant. It offers you enormous benefits, especially in the area of calculating the delivery period. The delivery period is often miscalculated when only the date of the last menstruation is known. Therefore, I can only encourage all women who want to get pregnant: Please measure your basal body temperature! I explain to you what you need to start immediately and determine your fertile days with the Symptothermal Method, in my Get Pregnant Starter Set.
Temperature only drops during the period? High level during menstruation?
Some women observed that the basal body temperature doesn’t go down again until the beginning of the next cycle – especially if they’ve had a triphasic curve. Then it is probably set up by the body in such a way that it goes back slowly. It then looks at first as if the high level takes place during menstruation, but there is usually the low level. These are all just empirical values and are not scientifically studied. That is why I, too, can only speculate at this point why in some women, and in some cycles, the temperature behaves in this way.
When is the increase on a triphasic curve?
The temperature increase is – as with any curve – always the first to result from the special Symptothermal Method evaluation rules. In other words, the second increase is insignificant for the evaluation. The first increase, however, is a definite ovulation sign when documented in combination with your cervical mucus highlight. By using the Symptothermal Method, you can very easily distinguish a possible second temperature increase from the actual “ovulation increase.“ On the one hand, you can distinguish it by the Temperature evaluation rules and, on the other hand, by double inspection with your cervical mucus course or Cervix Course.
Is a triphasic chart a pregnancy sign?
Unfortunately, a triphasic chart is not a definite pregnancy sign. There are simply too many documented cycles that are not pregnancy cycles and still show a triphasic temperature profile. For this reason, if you want to know very quickly if you are pregnant, I recommend you take a pregnancy test. In order for you to find the best test for yourself, I have in the article “My Pregnancy Test Experience”, some approved pregnancy tests, including Clearblue. However, if you already have a documented cycle curve, you can evaluate it and the days count from the first higher measurement. If you already have 18 high days or more, you are very likely to be pregnant.
Schematic diagram of the high level with 18 days
Two temperature increases in the cycle?
There was a rumour going around for some time that there could be two ovulation within a cycle. Due to the fact that two temperature increases have now been measured in some cycles, this rumour has intensified. The truth is that there may be multiple ovulations per cycle, while ONLY during the ovulation phase, which lasts about 11-18 hours. Due to Hormonal changes, it is not possible to produce another ovulation in the cycle phase after ovulation – the Luteal phase –. On the contrary – it is even prevented by the body, because it would not make sense to have another ovulation after implantation, for example, because at this stage completely different hormones are important for the newly created life.
My Symptothermal Method Pregnancy Curve
Yes, I had a triphasic happiness curve:). You can watch them here:

Triphasic temperature chart – My Symptothermal Method pregnancy curve.
The temperature curve during my second pregnancy clearly shows a second high position and thus a triphasic cycle curve. It’s a pretty good example of a triphasic curve because I’ve documented all the typical features of a triphasic temperature profile. Initially, the ovulation-related temperature increase took place on the 25th cycle day. I was able to evaluate my temperature with the normal evaluation rule and also my cervical mucus turnaround was timely to this temperature increase. My temperature rose by an average of 0.3 degrees Celsius – from around 36.55 degrees Celsius to around 36.85 degrees Celsius compared to the low position. Then about a week later, my basal body temperature rose again by 0.35 degrees – to an average of 37.20 degrees Celsius.
Summary: Triphasic pregnancy curve
Whether you have a triphasic pregnancy curve, you can only use the cycle observation and documentation of the ovulation signs cervical mucus and basal temperature to find out. If you’re planning to get pregnant right now, then you can start observing your cervical mucus today and measure your temperature for the first time tomorrow morning. You can read in my eBook “WHEN AM I FERTILE?”. There you will find a step-by-step guide to the Symptothermal Method (NFP), including exercise cycles and solutions. In addition, there is a very interesting chapter in my book about cycle diagnostics, where you will learn to limit the causes of why you have not become pregnant so far from your temperature curve. For example, with such cycle diagnostics on the temperature curve, I realized that I had luteal insufficiency and was then able to treat it by natural and conventional medical means. In the last chapter of the eBook you will also find 15 motivational testimonials of women who Got pregnant using the Symptothermal Method despite shiftwork, long-distance relationship, Luteal Insufficiency, Hashimoto, poor spermiogram, hormone chaos after taking contraceptive pills, endometriosis and PCOS.
I wish from the bottom of my heart that you get pregnant quickly and have a happy Bible time until that happens.
Your fertility expert
Anne